MISHub QI
Table of Acceptable Waste Percentages for Construction Materials
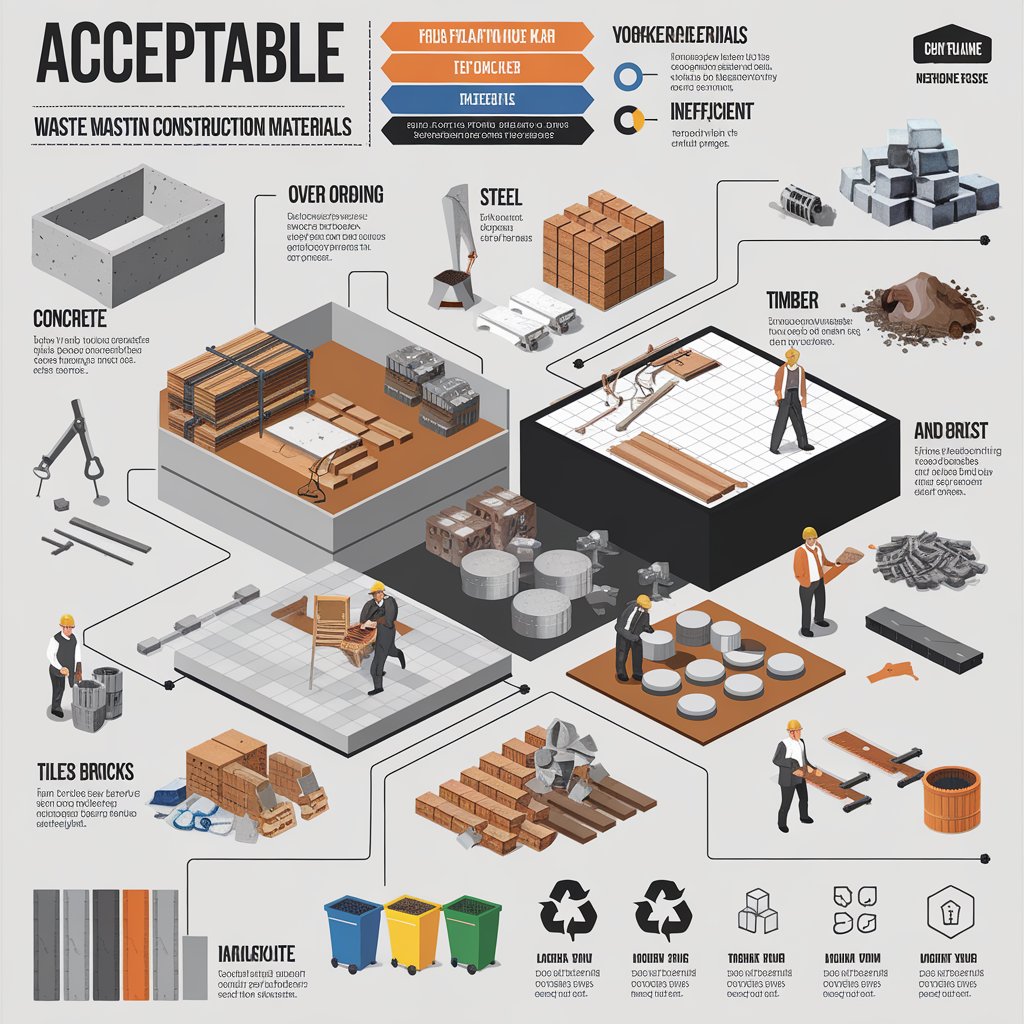
Table of Acceptable Waste Percentages for Construction Materials
A table with acceptable waste percentages for construction materials can be very useful in assisting with project management, cost control and construction planning. The percentages below are general estimates based on common construction industry practices, but may vary depending on factors such as the type of project, construction method and efficiency of materials management.
|
Building Material |
Acceptable waste percentage |
|
Concrete |
2% - 5% |
|
Armor steel |
3% - 7% |
|
Masonry Blocks |
5% - 10% |
|
Bricks |
8% - 12% |
|
Timber for Formwork |
10% - 15% |
|
Sand |
7% - 10% |
|
PVC pipes |
2% - 4% |
|
Tiles and Ceramics |
5% - 10% |
|
Painting and Coatings |
5% - 8% |
|
Gravel |
3% - 5% |
|
Waterproofing Materials |
4% - 7% |
|
Glass |
5% - 7% |
|
Materials for thermal insulation |
3% - 6% |
|
Cement |
1% - 3% |
|
Plaster and Drywall |
5% - 9% |
The percentages presented were based on sustainability reports and guidelines, such as the recommendations of the BS 8895-2 (Design for Material Efficiency) and good practice guides BRE Group (Building Research Establishment ). These sources often discuss controlling material waste in projects, with a focus on sustainability and resource efficiency.
Author: Eng. Francisco Quisele Jr.
Date of publication : 11/21/24
Share